If there’s one concept you learn this month that has the single greatest potential to improve the profitability of your site, the power of DIY multivariate analysis using the Web Optimizer is it. Let me explain.
What is Multivariate analysis and why should you care?
Multivariate analysis in the context of web sites is the science of changing elements on a page and studying the effect they have on your visitors’ behavior. If you have a web site, presumably you already have a goal and your site facilitates a behavior from visitors that contributes towards achieving that goal. There is likely a desired outcome you’re seeking on each visit – an action you want that person on the other side of the wire to take such as filling out a contact form or purchasing a product. This desired outcome is known as a conversion.
Improving your conversion ratio even one percent can lead to massive improvements in sales and profitability. This calculator is a simple way to run some what-if scenarios given your current order size, traffic and sales numbers. The easiest way to understand the benefit of improved conversion is to think about it as “miles per gallon” on a vehicle- think how much gas you would save if you doubled the fuel efficiency of your engine? But it’s even better with web traffic. If your current cost per acquisition for a customer is $5 per customer given all your fixed design/development/hosting costs and marginal costs like advertising, converting twice as many visitors with zero additional cost can bring your cpa down to around a dollar. This has a dramatic effect on profitability of your operation – the effect on profitability is non-linear especially if you feed the savings back into targeted promotion.
How GWO works
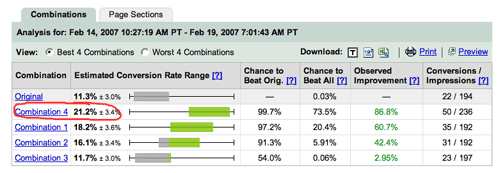
So now that you understand the value of improving conversion, let’s talk about how GWO specifically does it. Google Web Optimizer is javascript-based multivariate analysis tool that gives you the ability to test different versions of key pages on your site to determine the winning formula that produces the highest conversion. You set up experiments and GWO will dynamically serve different flavors of the same page randomly to different visitors and record the number of resulting conversions. The empirical data is then presented in a graph like the one below. Provided you have enough traffic to produce significant results, the tool reveals the winning combination along with the confidence level of the suggestion (ie. the statistical significance).

You can see that Graphic #4 outperformed the others and crushed the original graphic by almost double.
And the winner is…
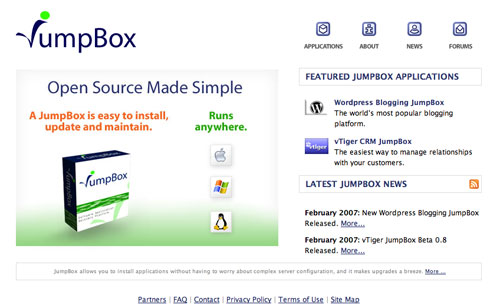
So this is all nice in theory but let’s take a look at a concrete example of how this helped us refine our messaging on the JumpBox site. A week ago I set up GWO on the JumpBox homepage and tested five different versions of the main graphic. Here’s the five versions I tested:


Can you guess which one performed the best?
(scroll down for the answer)

(keep going…)
 (wait for it…)
 (waiiiit for it….)


This version converted at a rate of 21.2% – double that of the original which performed at 11.3%. The breakdown for all is as follows:
 |
 |
 |
 |
 |
Combo 2
16.1% |
Combo 3
11.6% |
Combo 1
18.7% |
Combo 4
21.2% |
Original
11.3% |
Personally I thought gradients were unfashionable in ’96 but that just proves that conversion is not necessarily about spectacular design. The designers who create spiffy pages and defend their effectiveness from a design standpoint may be completely missing the boat in terms of the effectiveness of the design in converting traffic. Nobody can argue with real numbers from your own visitors – at that point the winning choice is no longer speculation, there is a right answer as confirmed by empirical data.
Anyways, it should be noted that for the purposes of this experiment I counted a conversion as a click through to the about page to read more about the JumpBox technology. Down the road it will make more sense to count a download of our free trial as the conversion but I did it this way for now to get more data immediately on the effectiveness of the homepage graphic for moving people to that next page. I didn’t utilize the multivariate capabilities of GWO either- i used it more as an A/B split test (actually, A/B/C/D/E split). GWO can juggle permutations of headlines, graphics, text, calls to action, and any other displayable element on the page and intelligently report the winning assembly of items. Another aside, we used StumbleUpon advertising as a fire hose of semi-qualified traffic that we could turn on at will to accelerate testing. This worked very well.
What you do if you are interested in using GWO
The video tutorial from Google nails the setup process so I won’t rehash the steps for how to implement it. GWO is in private beta at the moment but it seems they’ve been letting in groups more frequently lately so sign up here and wait for your number to be called. You’ll know you’re in when you see this additional tab appear in your adwords account:

My only complaints about the tool so far are related to usability – it’s not quite there yet for non-technical users. You will need access to paste javascript code into your web pages as well as the technical ability to do so. I would love to see GWO use a single block of js that you install once and allows you to run experiments serially without having to strip out the old js and re-paste in the new. Google’s best move going forward with this will be to author plugins for the popular CMS platforms and ecommerce engines to simplify adoption and save people from ever having to futz with javascript at all. Other than those gripes, this is an amazing tool for people with web sites. No more speculative argument about “this design is way better than that one” – now there is a definitive answer to which designs and promotions work best.
Have fun with it.


